3.2. Asset Types: Stocks, the Second Half
Objectives
+ Relate valuation to the Efficient Market Hypothesis
+ Introduce and explain various measures of company performance
+ Consider measures of company stock performance
+ Learn about stock market indexes
Lecture: Stocks
First Section – More on Valuation
1. The Efficient Market Hypothesis (EMH) is a model of how investors incorporate information into their market decisions-to buy or sell assets. It proposes that every piece of relevant information about a company, the industry and the economy, is being reflected in the Demand/Buy and Supply/Ask curves for the stock, and these combine in the market to decide the share price. There cannot be any “surprises.” This does not mean there is no uncertainty in asset markets. Quite the opposite, all that is left to cause prices to be different than what investors as whole expect is pure randomness. When everything that can be known is present in the market, the only thing left is that which is not known–uncertainty.
The EMH is often associated with the random walk hypothesis. This proposes that stock price changes follow a random process, and therefore they cannot be predicted.
The EMH is controversial and not accepted by every economist. In recent years with the introduction of Behavioral Economics, the EMH has fallen from favor. There are just too many examples of systematic or predictable (to some extent) outcomes for it to be purely random. But it’s a model, and as such highlights some essential elements and characteristics of financial markets.
If the EMH is correct, then the current market price of an asset, say a company share, is the correct price to use when valuing a company. There is no difference between the intrinsic value of a company and the market value of a company, and if there is, it’s due to random, unpredictable, factors.
As I said in the first part of this topic, valuation can be difficult. Professor Damodaran of NYU teaches a finance class on valuation, and he provided an example of valuing Tesla, the company that produces high end electric cars. It’s interesting, as are the comments it generated.
Second Section – Assessing Company health by the numbers
1. Publicly traded companies are required to produce annual reports to shareholders, and quarterly reports to the public through Securities and Exchange Commission regulations.
2. All the accounting information for a publicly traded company is therefore available to investors, analysts and brokers. These include:
~ Income Statement. This is the profit and loss statement
~ Balance Sheet. This shows the assets and liabilities at a point in time.
~ Cash Flow Statement. Shows how cash flows in to, and out of, the company.
~ Financial Ratios – Calculated using data from the statements above, they describe and measure the financial health of a company.
Financial Ratios (calculated statistics)
Just as people see their physicians for a check-up, where data such as weight, blood pressure, heart rate, LDL/HDL levels are collected to assess the general health of a person, the equivalent can be performed on a company. Just check out the list of ratios in the Wikipedia page on Financial ratios!
We are going to focus on a few of these ratios, either because they are common, (or commonly misunderstood,) or of particular interest, in my opinion.
The Price/Earnings ratio
In the most general sense this ratio compares the price per share to the net earnings, or profit, per share of the company. Accountants can argue about which particular numbers indicate net earnings (after tax, after depreciation, etc.) but Economists are quite happy to talk about net earnings or some similar measure of profits. Companies are in business to make profits, and distribute them to owners/shareholders as discussed in the previous topic, Stocks, One.
The average PE ratio for US companies (eg those in the S&P 500 Index) is 15. This means that company X makes about $3 in profit per share, which sells for about $45 on the stock market. So why would ANYBODY pay $45 for a share in a company that only makes $3 profit per share?
Well, if the company only lasted one year, that wouldn’t be a good deal, but companies last a long time, and (try to) make profits every year of that long life. So if a company makes $3 a year profit per share for 20 years, the $45 share has “generated” $60 in profits for the company, and the shareholders.
Remember the valuation formula: V = D1 + D2/(1+d) + D3/(1+d)^2 + … + DT/(1+d)^T. Divide both sides by S, the number of shares outstanding, and you get V/S is the sum of dividends per share each year, discounted by an appropriate factor. (In this example I haven’t discounted the first year dividend, but that’s not a big deal.) The value of the company today is created by future profits, after discounting.
Consider two very different companies: duPont (DD) a chemical processing company, and JPMorgan Chase (JPM) a financial company. Here are some financial statistics from Oct 2015:
| Ticker | DD | JPM |
| MCap | $56b | $221b |
| Price | $56 | $61 |
| PE | 16.8 | 11.0 |
| EPS | $0.12 | $1.35 |
Both companies sell for about the same share price, but JPM is worth about four times what duPont is worth, as measured by market capitalization (MCap). But shareholders are paying for something quite different in a JPM share compared to a duPont share. JPM is making $1.35 in net earnings (profits) per share (EPS), whereas duPont is only making 12 cents per share, less than 10% as much as JPM. Investors are buying JPM because they feel the financial sector is solid and has a good record of making profits, even during the recession. The share price is expected to rise. DuPont on the other hand hasn’t had any good news and has revised earnings and profits down.
The PE ratio tells us something about a company, especially how other investors, through the market, see the present verses the future of the company. For example, Apple (AAPL) sold in Oct 2015 for around $110 and with a PE ratio of 13, a little below the average. Investors see not only a large, mature company, but one with good prospects of future profits. Compare this to a company like Facebook (FB) with a PE ratio of 100(!) With a market capitalization of $265b it’s a darn big company, no question. But at a price in Oct 2015 of over $90 combined with a PE ratio near 100 it remains a company that investors are expecting a whole lot more from in the future than they are getting right now with earnings per share of fifty cents.
Other financial ratios – the DuPont equation
The DuPont (the one and same plastics company mentioned above) equation breaks the return on equity (ROE) into three parts representing how the firm turns equity into profits.
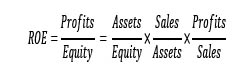
This equation breaks return on equity into the product of a Leverage ratio, an Efficiency ratio, and a Profitability ratio. The company takes equity and uses it to leverage the purchase of assets with debt, then uses those assets to make stuff to sell, or just sell stuff directly (like Walmart, which doesn’t actually make stuff,) on which they make some profit.
The equation is often used to compare the performance of different types of industries by comparing in which areas companies have strengths. For example, Apple isn’t leveraging its equity all that much (even with the recent bond issue), and because of the technology involved uses quite a lot of assets to make its products, but it does have very high margins (iPhones have margins of about 50%.) Compare to Walmart, who’s strength lies in the efficiency ratio–they use their assets, primarily shelf space in huge stores, to sell lots of stuff. They are constantly restocking those shelves with products that they make a pretty low margin on, but make profits on volume. By highlighting in which area a company has strengths, we can also predict where it may face challenges in the future. A company’s growth has to come from an improvement in one, or more, of these ratios over time. If Apple can’t maintain profit margins because they must lower prices or pay higher production costs, then their future looks less rosy.
Fundamental Analysis is one of two basic types of analysis used to decide what equity assets to include in a portfolio. (The other is Technical Analysis, and more will be said about both these in the section on portfolio composition later in the course.) Fundamental Analysis looks at the financial health of a company, and its industry, within the broader economy (which may include the global economy.) The analysis uses financial ratios as one element in developing an overall picture of the company. Warren Buffett, among other oracles, has always said “buy the company, not the stocks.” Know the company, know the industry, and then buy those things inside your circle of competence. (Check out this Buffett video on this topic.) What Buffet is promoting is a form of fundamental analysis. While it involves review and comparison of many financial ratios and data, there’s not specific formula, or standard method to the analysis. Consequently it’s not proscriptive.
The Quiz is available on the Learn website.
Aside: Market Indexes
There are thousands of stocks traded on stock markets in the US and around the world. In order to produce a summary measure of “what the stock market is doing” we have to create a price index. The most famous price index is the Consumer Price Index (CPI) produced by the US Department of Labor Bureau of Labor Statistics. In general, an index is a unit-free measure of something. The CPI is set at a value of 100 at some date, and is the quantity-weighted average price of a basket of goods and services the average person buys. So it contains milk, and bread, and gasoline, and cell phone service, and cinema tickets, and shoes–each in the quantity an average person buys. The average thus calculated is set at a value of 100 at a particular date. Subsequently the weighted average price of that same bundle of goods and services is calculated and compared to the base price. If it has gone up, the CPI goes up, say to 102. If the bundle is cheaper, the index goes down, to say 97.
Since shares are sold in markets, the average price of a portfolio of shares weighted by the quantity of shares traded can be calculated in the same way as the CPI is calculated. The Dow Jones Industrial Average is such an index calculated using the prices of 30 company shares chosen to represent the largest core companies in the US. The S&P500 market index uses the prices of 500 mid- and large-sized companies to calculate the index. These, and the many other stock market indexes, are designed to provide a summary measure of the “price of a representative portfolio of shares”, just as the CPI is intended to indicate the general level of prices in the economy. And just as the CPI doesn’t indicate the price of a particular good or service, the stock market indexes don’t tell us what the price of an actual stock is, but only tells us what the general, or overall, price of shares is. Just as an increase in the CPI indicates a general rise in prices, even if some prices have fallen, an increase in the DJIA indicates an improvement in the stock market, even if some shares have experienced a fall in price.
You can read more about stock market indexes in this Investopedia article.
Additional Resources/links
1. This paper about financial ratios from Dr P Drake of James Madison University is very informative.
2 . Wikipedia entry on the DuPont equation:
http://en.wikipedia.org/wiki/DuPont_analysis
Homework
Write one-two page essay on the following topic.
When might an investor want to short sell a stock? How is this done? Is this part of a “standard” portfolio? Does it increase portfolio risk?
Discussion
Discuss the following question:
There are almost as many statistics (numbers) available for a company as there are for a baseball game! There’s the market cap., P/E ratio, Beta, ROE, and many, many more. Are some more important than others? Which ones would you focus on, and why?
